
Assalamualaikum semuanya
Rasanya sudah lama tak menulis sesuatu di sini
Almaklumlah masa yang ada tidak mengizinkan
Sem 6 agak padat dengan assignment ,research and practical report.
So hari ini aku nak berkongsi something yang related with research and your further study
Haa mesti korang dah tau kan?
Okay this a few tips or guidelines macam mana nak guna SPSS untuk key in data Reliability , Normality, Correlation and Regression.
Apa yang penting desktop or laptop korang kena ada SPPS ni.
1. Reliability Test
i. Click analyze
ii. Click Scale - reliability analysis
iii.Masukkan Dependent Variable ( Tulis Scale label)
Masukkan Independent Variable ( satu per satu).
Contoh :


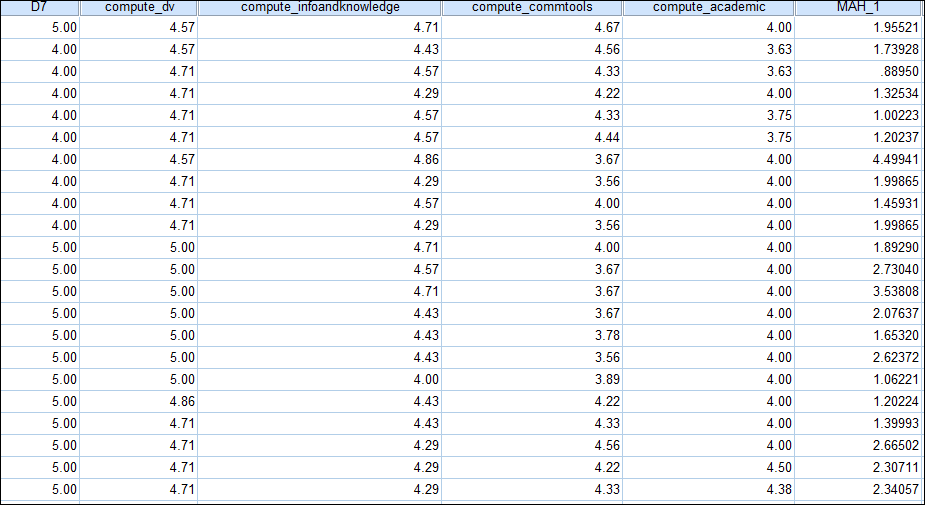
2. Compute Variable
Sebelum dapatkan normality, kita perlu compute IV dan DV terlebih dahulu
i. Click Transform
ii. Click compute variable
iii. Target variable , compute DV dan diikuti dengan IV ( satu persatu)
iv. Pergi ke numeric expression
ex : (A1+A2+A3... A7) / 7 ( kena bahagi dengan total question of IV or DV).
* Peringatan untuk numeric expression sila masukkan IV/ DV satu persatu mengikut part.
v. Click Okay

3. Normality
i. Click analyze
ii. Descriptive Statistics
iii. Explore
iv. Masukkan DV/IV yang dicompute seperti compute_ DV ke dependent list
v. check plot:
* Click Factors level together
* Descriptive : histogram/ stem leaf
*Normality plot with tests
*continue
vi. key in IV and DV satu persatu.


4. Frequencies.
i.analyze
ii.descriptive statistics
iii.frequencies
iv. key in gender , age , marital ( demographic, satu per satu).
check charts ( tick ikut suka barchart/ piechart, based on yours )


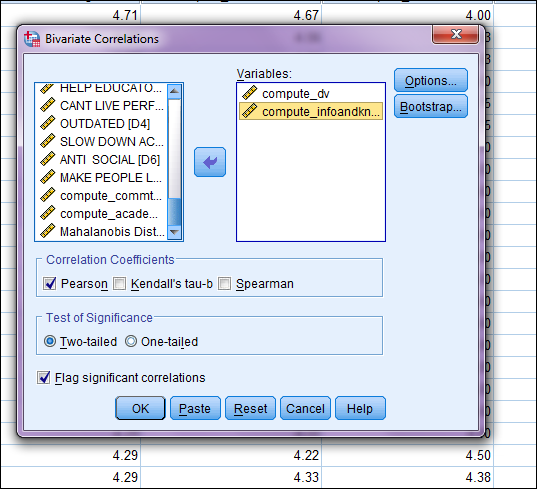
5. Correlations
i. analyze
ii. correlate
iii. bivariate
iv. masukkan compute dv and compute iv1
ulang dan masukkan compute dv and compute iv2
sampai habis dv and iv
v. choose pearson or spearman ( up to researcher)
vi. choose 2 tail or 1 tail

6. Regression ( Factors most influence IV towards DV)
Check B ( besar)
i. analyze
ii. regression
iii. linear
iv. dependent ( DV dah compute)
IV ( IV dah compute). ( masukkan semua IV)
v. method ( enter)
vi. option :
* plot ( ZRESID) > masukkan ke Y
( ZPRED) > masukkan ke X
* continue
* save ( tick mahalanobis)
*continue
*option ( tick pairwise)
*continue
* okay


Kegunaan Regression ialah untuk check model Summary, Annova and Coefficient).
Sebarang soalan boleh diajukan di ruangan komen di bawah. Terima kasih :D


teruskan usaha pasti berjaya...
ReplyDeleteThis comment has been removed by the author.
ReplyDelete